Flow Quick Runner
Quick Runner is the Forge module for testing your workflows against a running environment in real time: it starts instances, fires transitions, renders the active state's view, and lets you inspect instance data (data, history, correlations, raw) live.
Two ways to open it:
- Right-click a workflow JSON under
Workflows/in Explorer → Open Quick Run - Command Palette → Forge: Quick Run → pick the workflow from the list
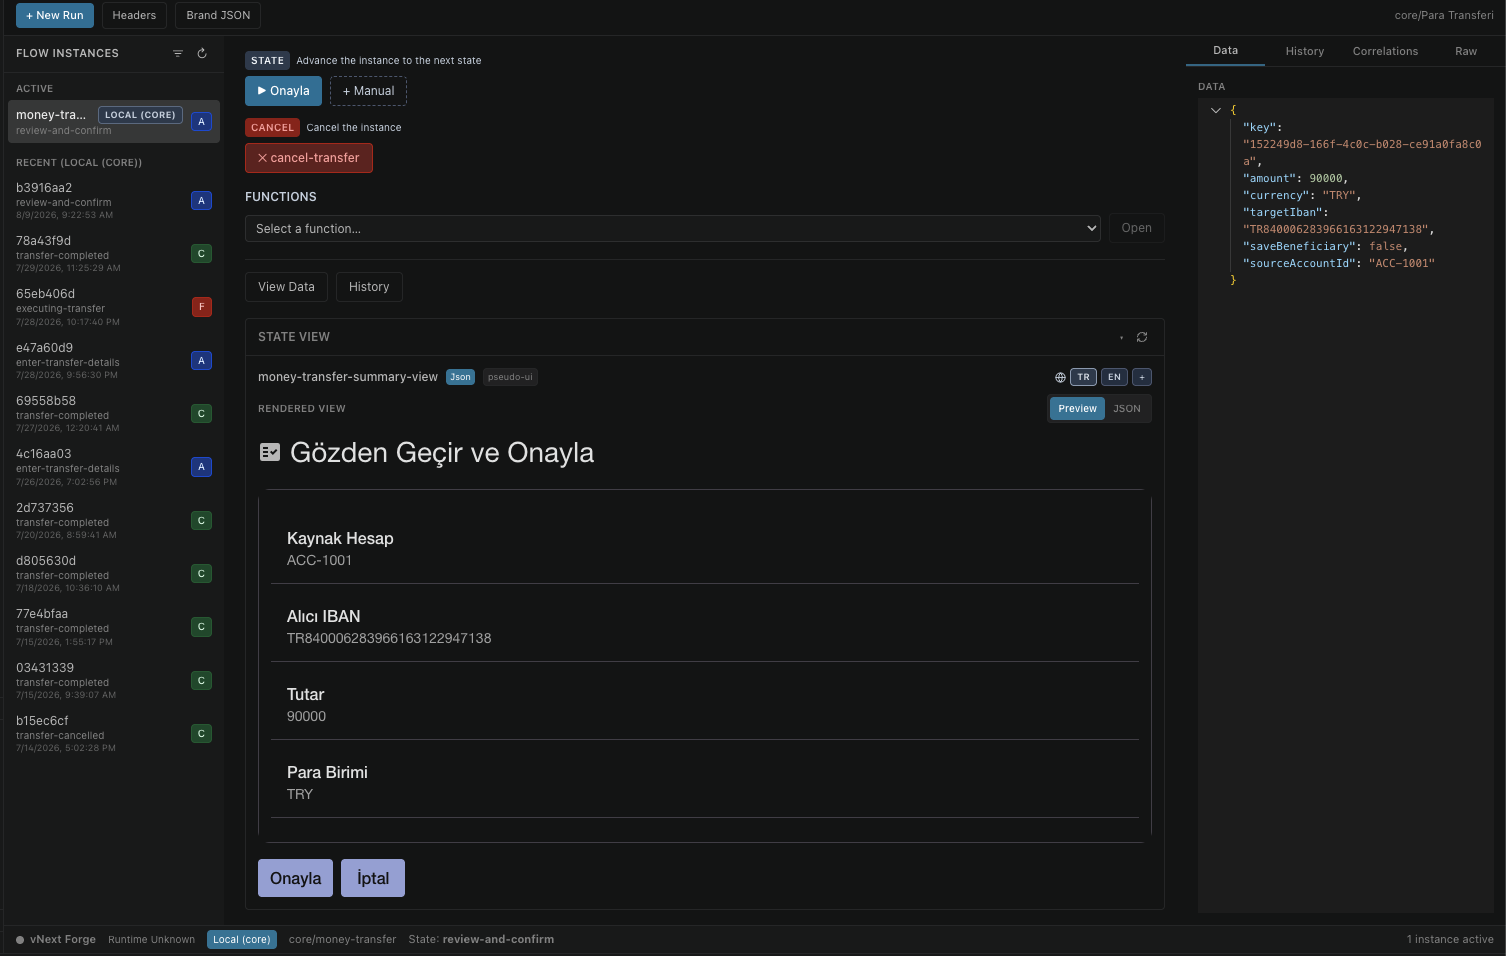
The examples on this page were captured with the core/money-transfer flow against an active Local (core) environment.
Main Screen
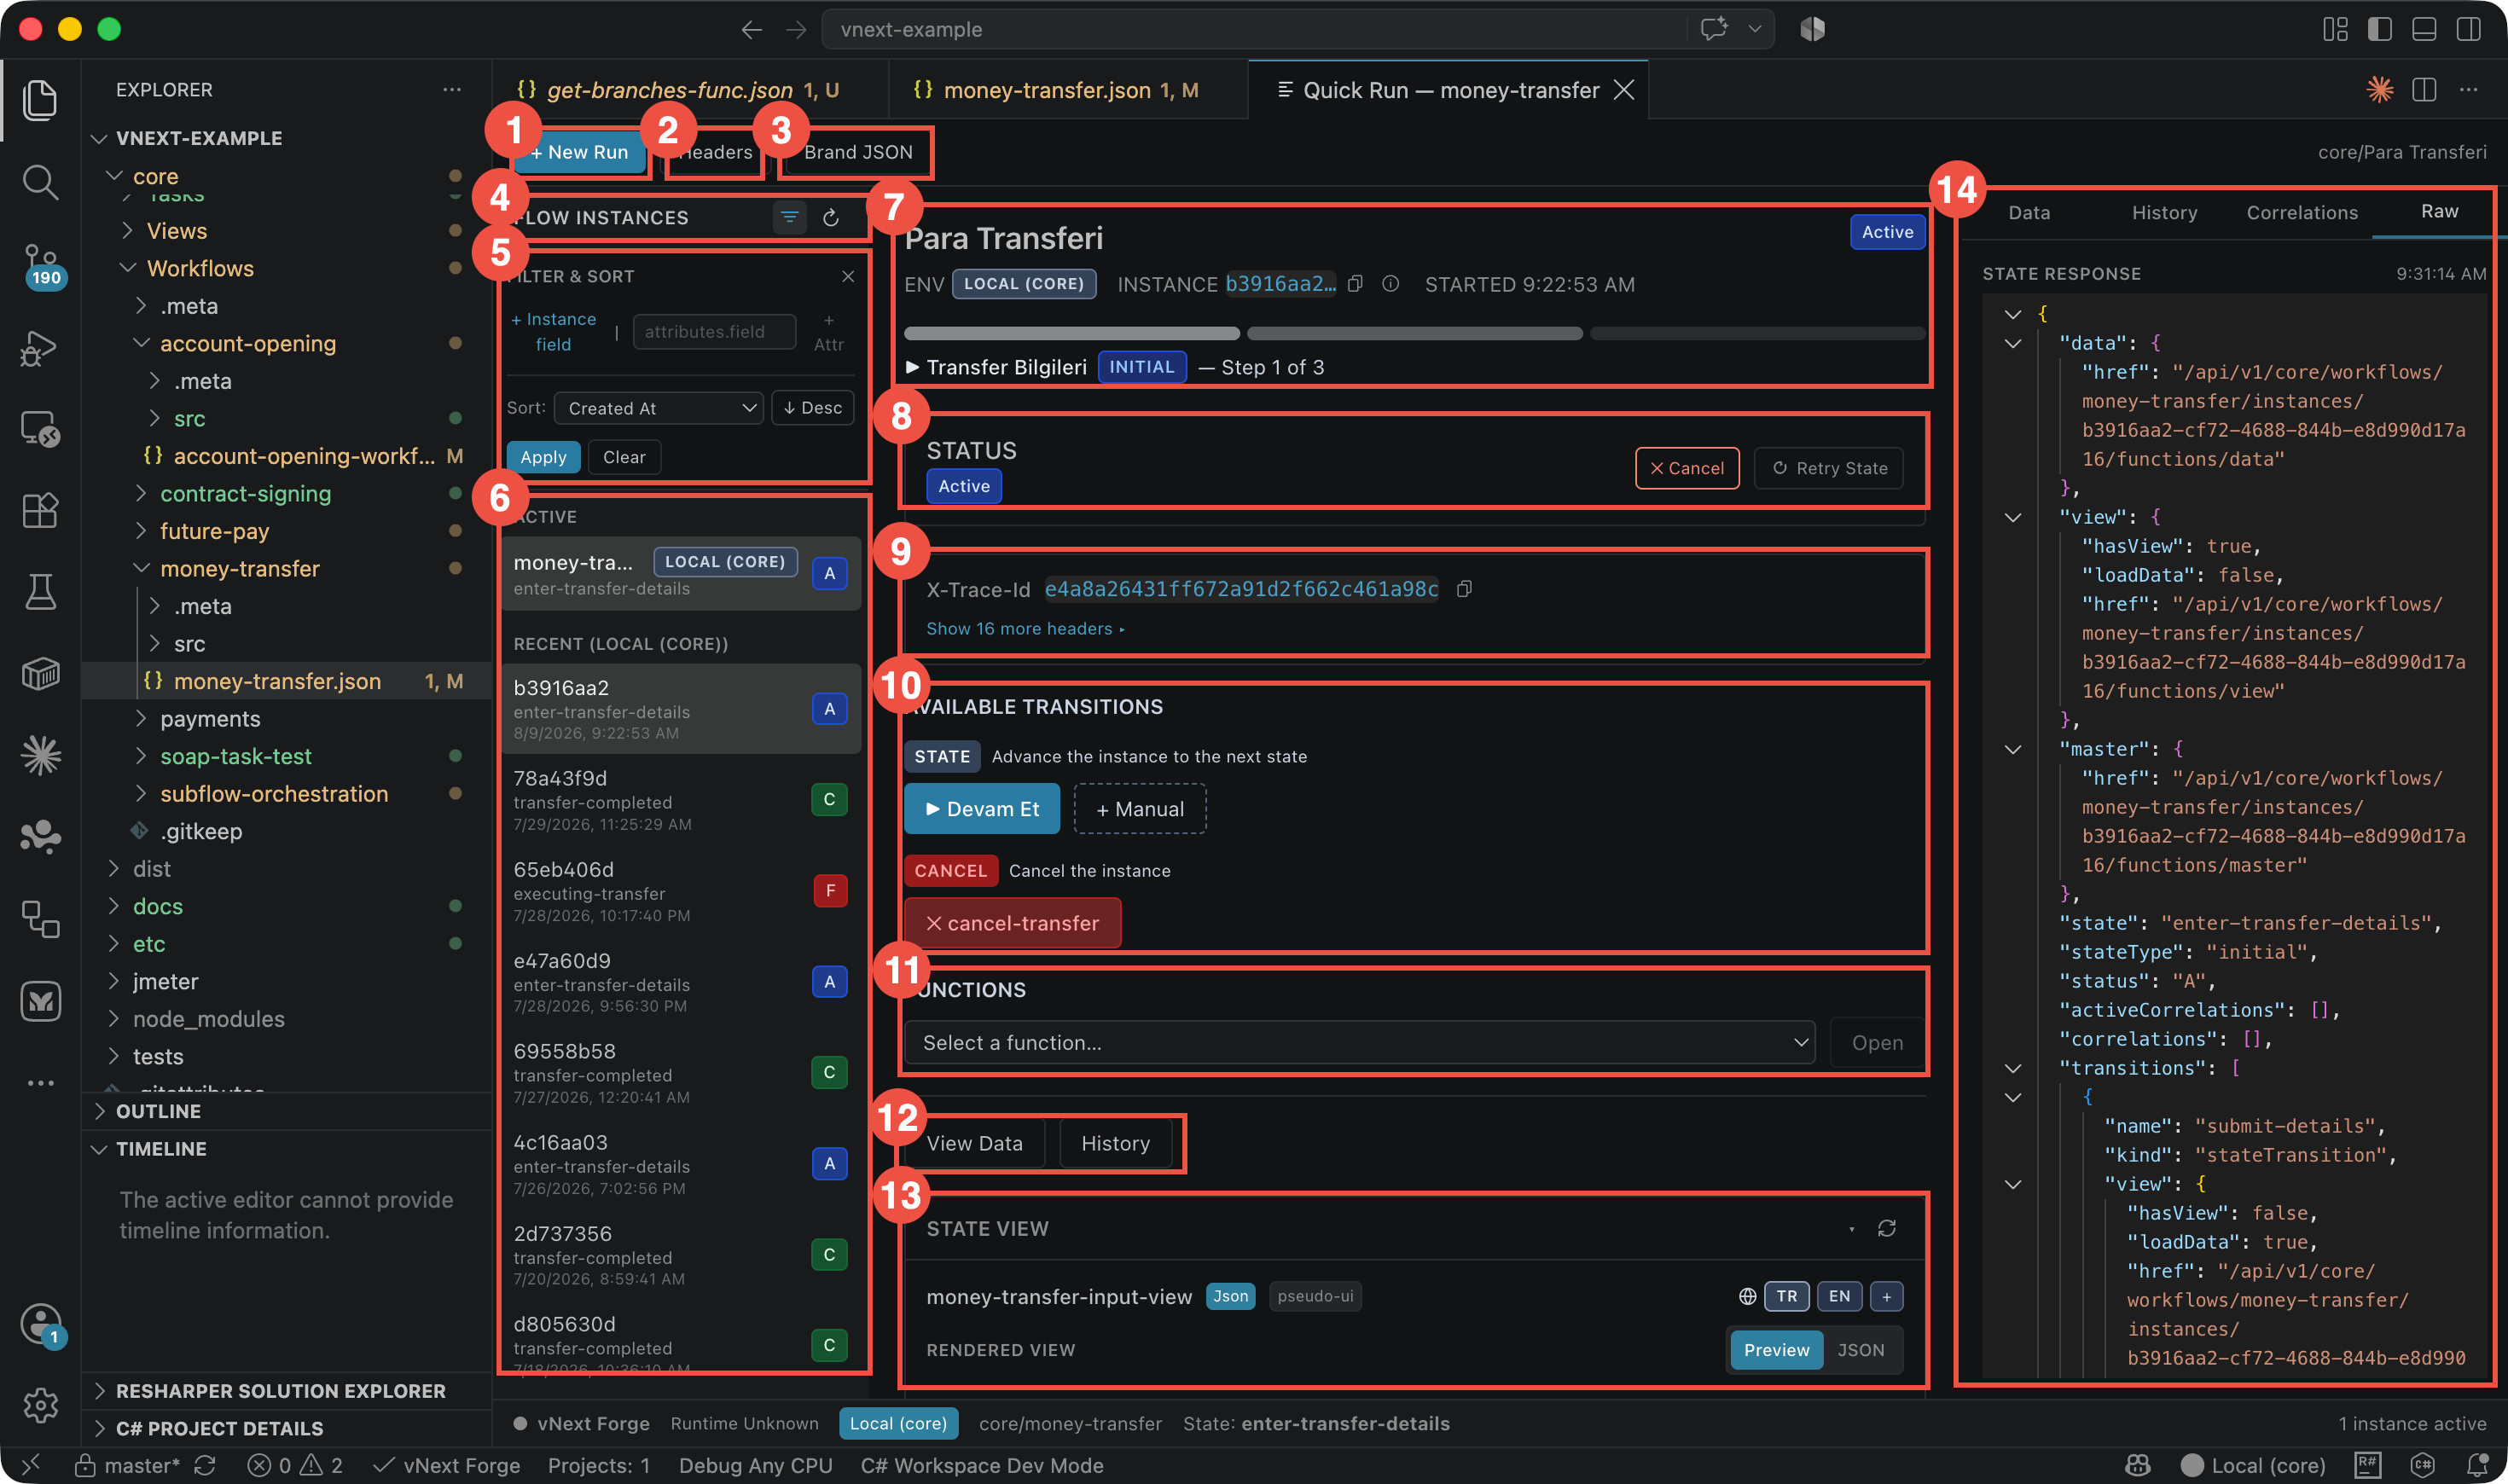
| # | Area | Purpose |
|---|---|---|
| 1 | + New Run | Opens the Start Flow Run dialog to start a new instance. |
| 2 | Headers | Manages global headers added to every request (e.g. identity/tenant headers). Counterpart of the Quick Run → Global Headers setting. |
| 3 | Brand JSON | Tenant brand/style configuration — makes the pseudo-ui render match your corporate theme. |
| 4 | Flow Instances header | The filter icon opens the filter panel; the refresh icon reloads the list manually. |
| 5 | Filter & Sort | Filters on instance fields or attributes.* paths, sort key (Created At) and direction; Apply/Clear. |
| 6 | Instance list | ACTIVE (live-monitored) and RECENT instances. Each row shows the short instance ID, current state, and creation time; the badge on the right shows status: A (Active, blue), C (Completed, green), F (Faulted, red). |
| 7 | Instance identity | Workflow label (in the active language), status badge, environment, instance ID (copy + ⓘ Instance Details modal), start time, and the step indicator (e.g. Transfer Details INITIAL — Step 1 of 3). |
| 8 | Status card | Instance status; Cancel (cancels the instance) and Retry State (re-runs the current state — useful for faulted states). |
| 9 | Trace headers | X-Trace-Id and other response headers (Show N more headers). The trace ID is the exact key for correlating with runtime logs. |
| 10 | Available Transitions | Transitions out of the current state, grouped by trigger type: STATE (advances the instance) and CANCEL. + Manual fires a transition name not in the list. Clicking a button opens the Fire Transition dialog. |
| 11 | Functions | Pick a function bound to the workflow and open it in the Function Quick Runner. |
| 12 | View Data / History | Shortcuts to the Data and History tabs in the right panel. |
| 13 | State View | The active state's view: view key, content type (Json) and renderer (pseudo-ui) badges, language switch (TR/EN/+), and the Preview / JSON toggle. |
| 14 | Instance panel | The Data / History / Correlations / Raw tabs (below). |
Starting an Instance (Start Instance)
+ New Run → the Start Flow Run dialog:
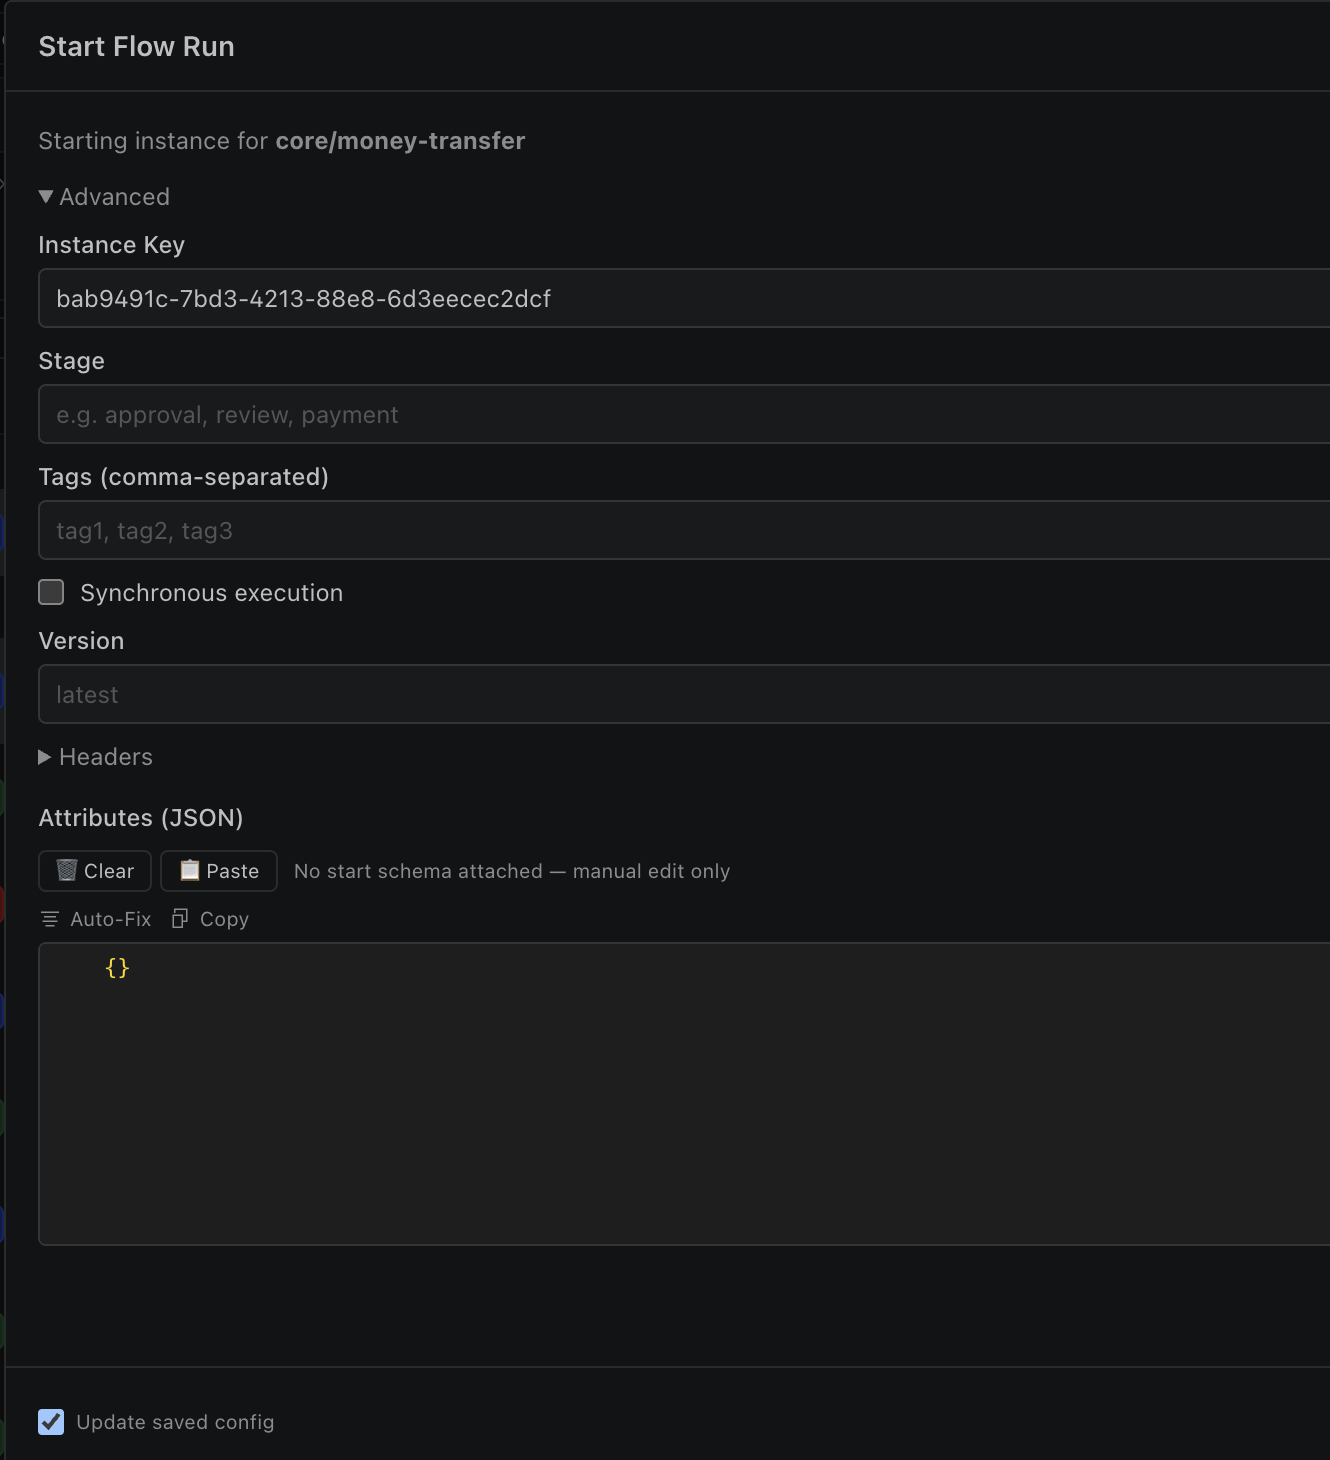
- Instance Key — the instance key; Generate produces a GUID.
- Stage / Tags — optional labels for the instance.
- Synchronous execution — synchronous run; the response returns once the flow reaches its first waiting state.
- Version — target workflow version (default
latest). - Headers — extra headers for this run only.
- Attributes (JSON) — the start payload. If a schema is attached to the start transition it renders as a form; otherwise (No start schema attached — manual edit only) you get a JSON editor. Preset/Save stores payloads for reuse; Auto-Fix repairs JSON errors.
- With Update saved config checked, the values are remembered for the next run.
Start Run starts the instance; it appears in the list and the detail panel opens.
Firing a Transition (Fire Transition)
Clicking a button under Available Transitions opens the transition dialog:
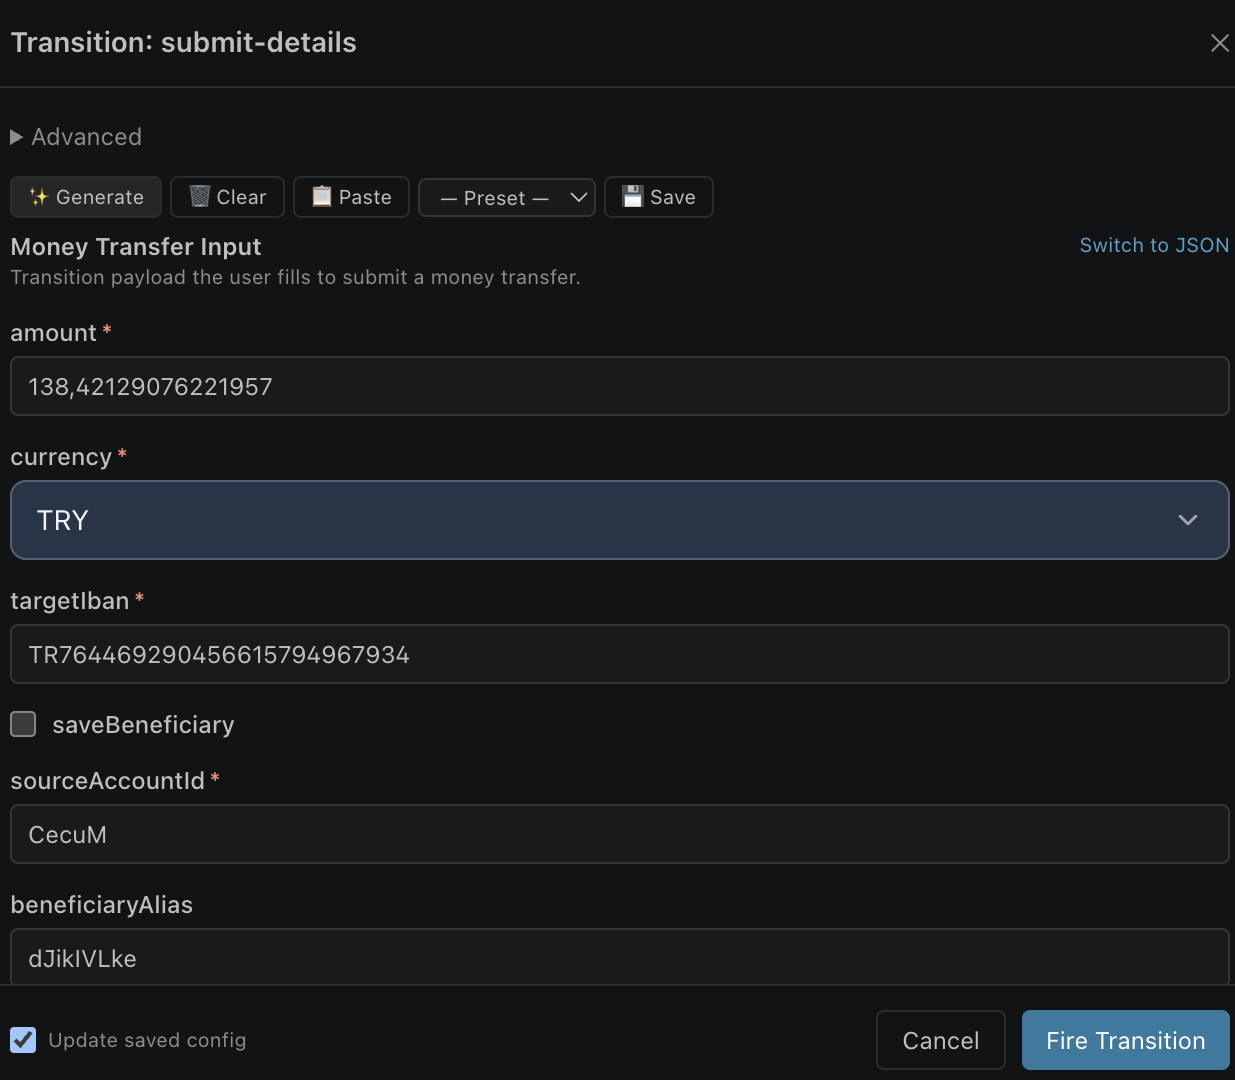
- If the transition has a schema, the payload renders as a form (field types, required markers, selects); Switch to JSON switches to raw JSON.
- ✨ Generate produces a sample payload from the schema — ideal for quick tests (the fields in the screenshot were filled by Generate).
- Clear / Paste / Preset / Save — clear the payload, paste from clipboard, use saved presets.
- Fire Transition fires it.
After firing, the panel updates itself via long polling: the step indicator and state advance, the new state's transitions appear (in the example Devam Et → Onayla), the State View renders the new view, and a record lands in History.
State View — pseudo-ui Rendering
The active state's view renders as a real form/screen in Preview mode — but only when the view's renderer is pseudo-ui:
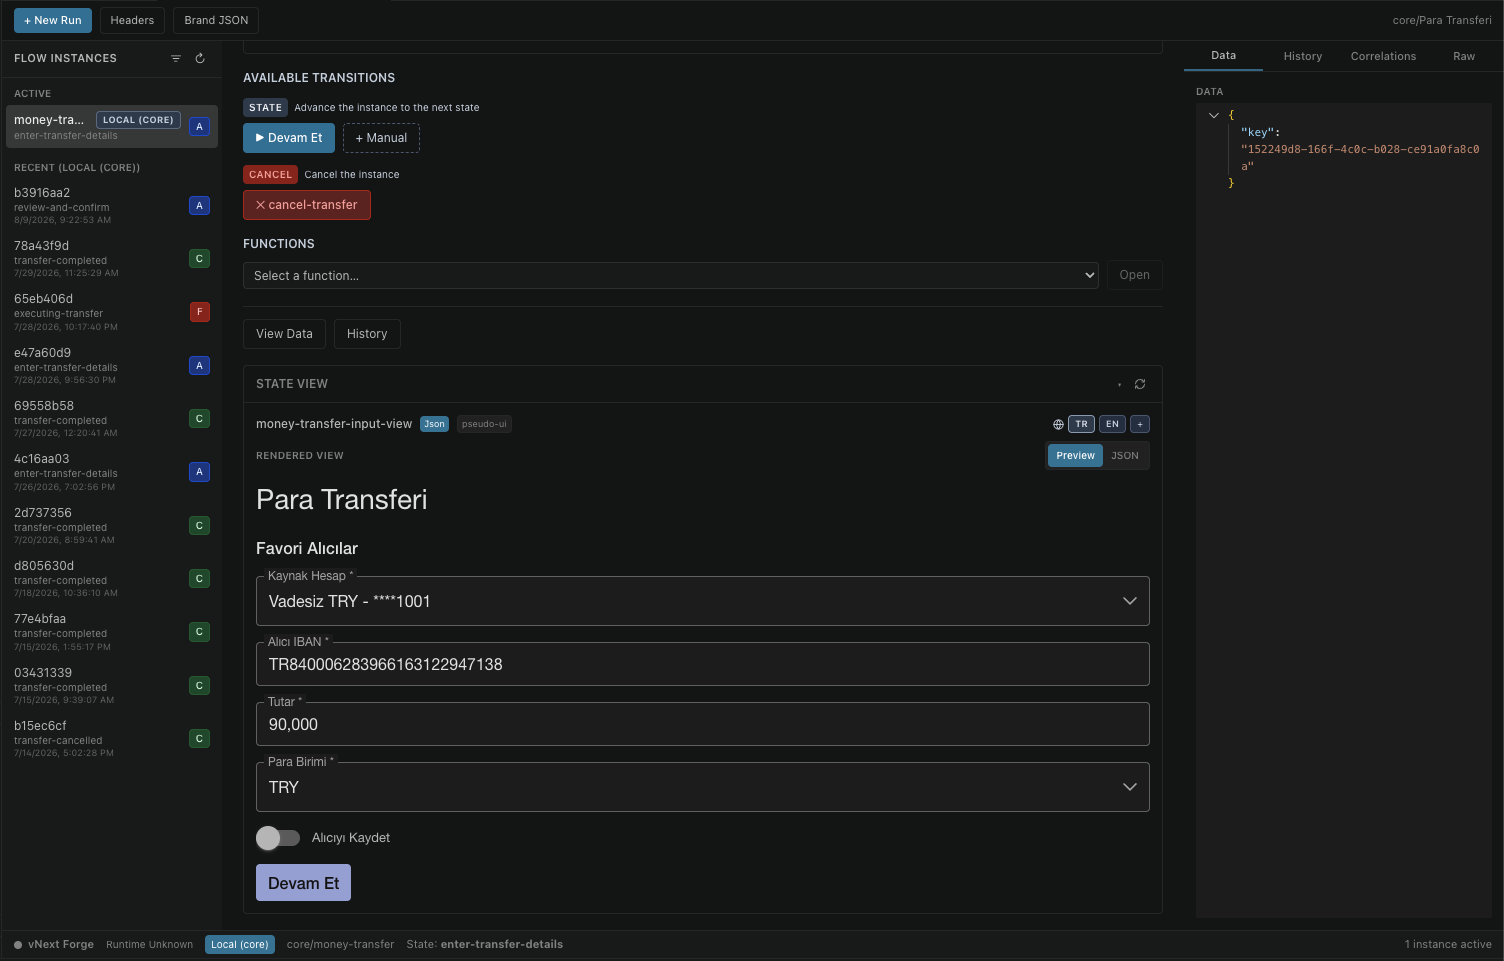
- TR / EN / + — switches between the languages defined in the view's
labels; + adds another language preview. - Preview / JSON — toggles between the render and the raw view JSON.
- If the renderer is not pseudo-ui (a custom front-end vocabulary), Forge cannot produce a visual render; only the JSON tab content is shown.
- If the state has no view (
view.hasView: falsein the Raw response), the State View section stays empty.
After a transition the same section loads the new state's view — the summary/confirmation screen in the example:
Data / History / Correlations / Raw
The four tabs in the right panel show different slices of the instance:
- Data — the JSON tree of the instance data (everything the workflow has accumulated so far).
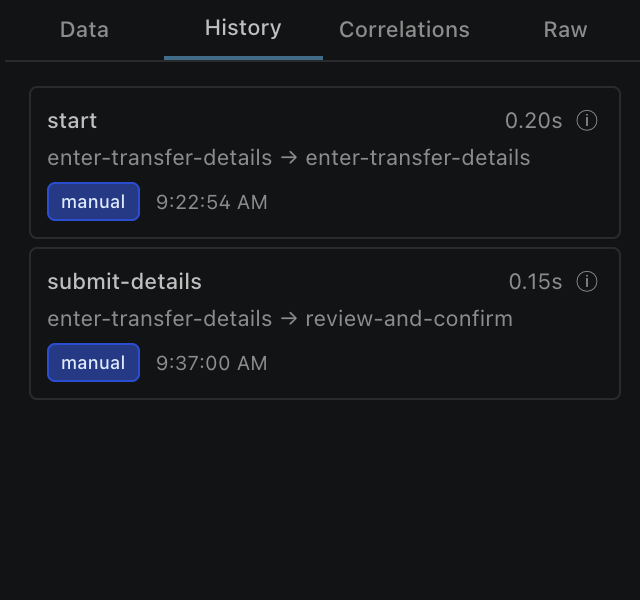
- History — one record per transition: name, duration,
source state → target state, trigger type (manual,auto, …), and time.
- Correlations — the instance's active correlation links (event/subflow relations); No active correlations when there are none.
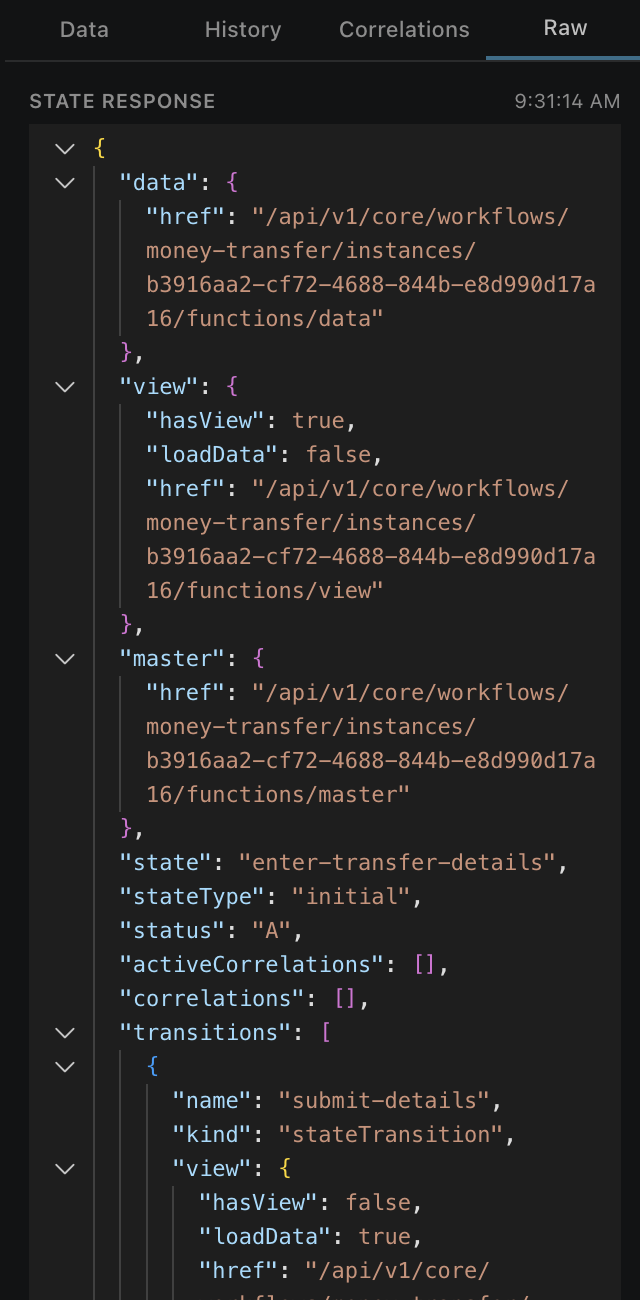
- Raw — the full STATE RESPONSE returned by the runtime: the
data/view/masterfunction hrefs,state,stateType,status,activeCorrelations, and the currenttransitions[]array (with each transition'skindand view info). The primary source when debugging.
Instance Details Modal
The ⓘ icon next to the instance ID opens the detail modal:
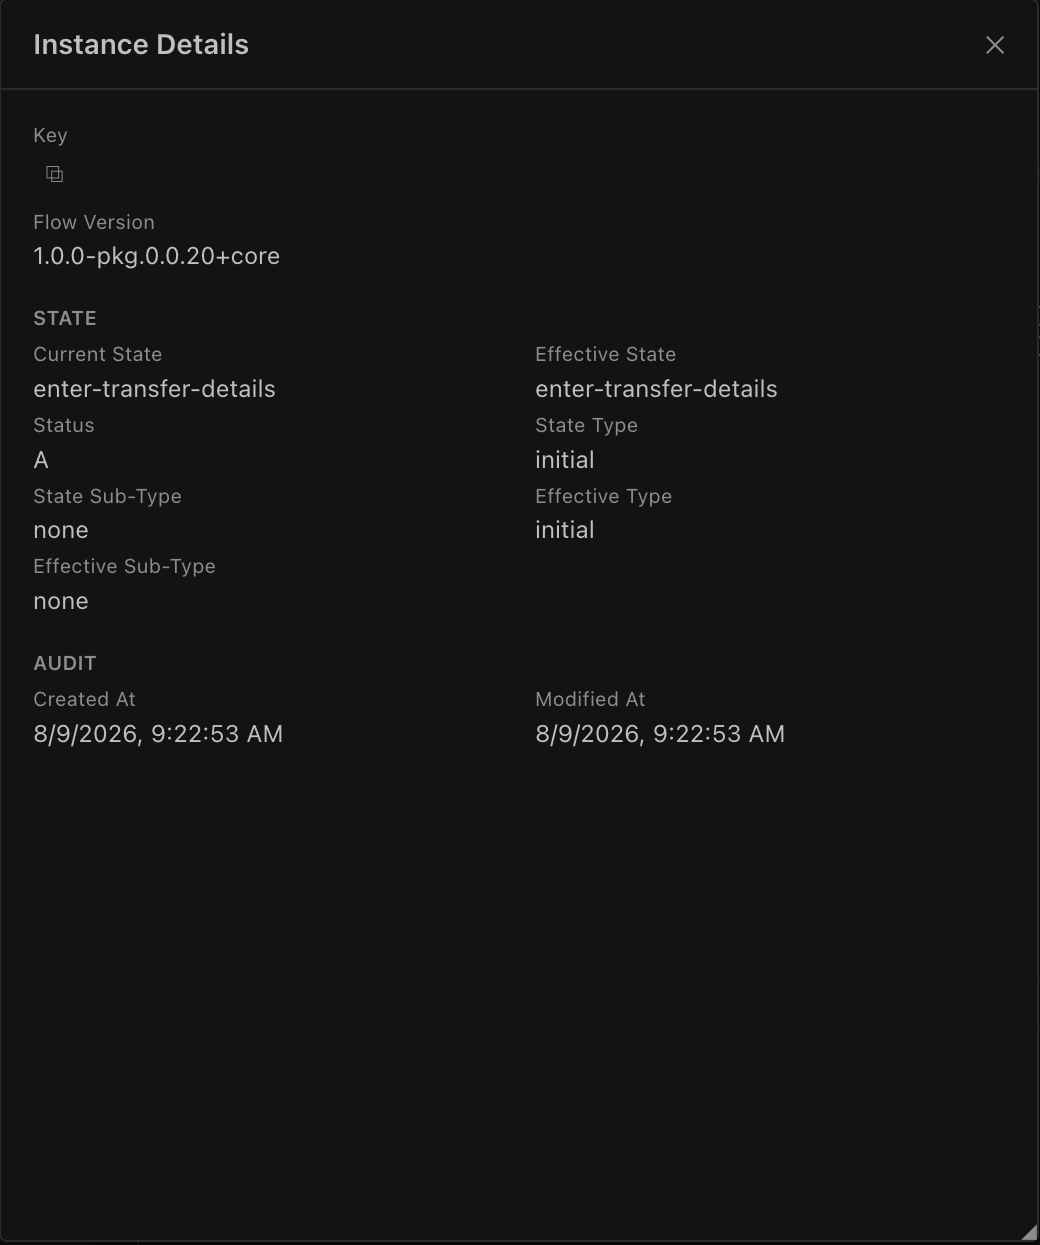
- Key and Flow Version — the workflow version the instance runs on, including the deployed package version (e.g.
1.0.0-pkg.0.0.20+core). - State — Current/Effective State, Status, State Type and Sub-Type.
- Audit — Created At / Modified At.
Long Polling and Live Monitoring
Quick Runner watches active instances via long polling: when a transition fires — or automatic transitions run in the background — the screen (state, transitions, State View, History) refreshes without manual reloads. Polling behavior is governed by the Retry Count and Interval (ms) settings under Forge Tools → Settings → Quick Run.
The bottom status bar always shows the current context: active environment, domain/workflow, current State, and the N instances active counter on the right.
Function Quick Runner
There is a dedicated panel for running functions standalone. Ways to open it:
- Right-click a function JSON under
Functions/→ Open Function Quick Run - Command Palette → Forge: Function Quick Run → pick the function
- From the Functions section of a Quick Run instance detail (with instance context)
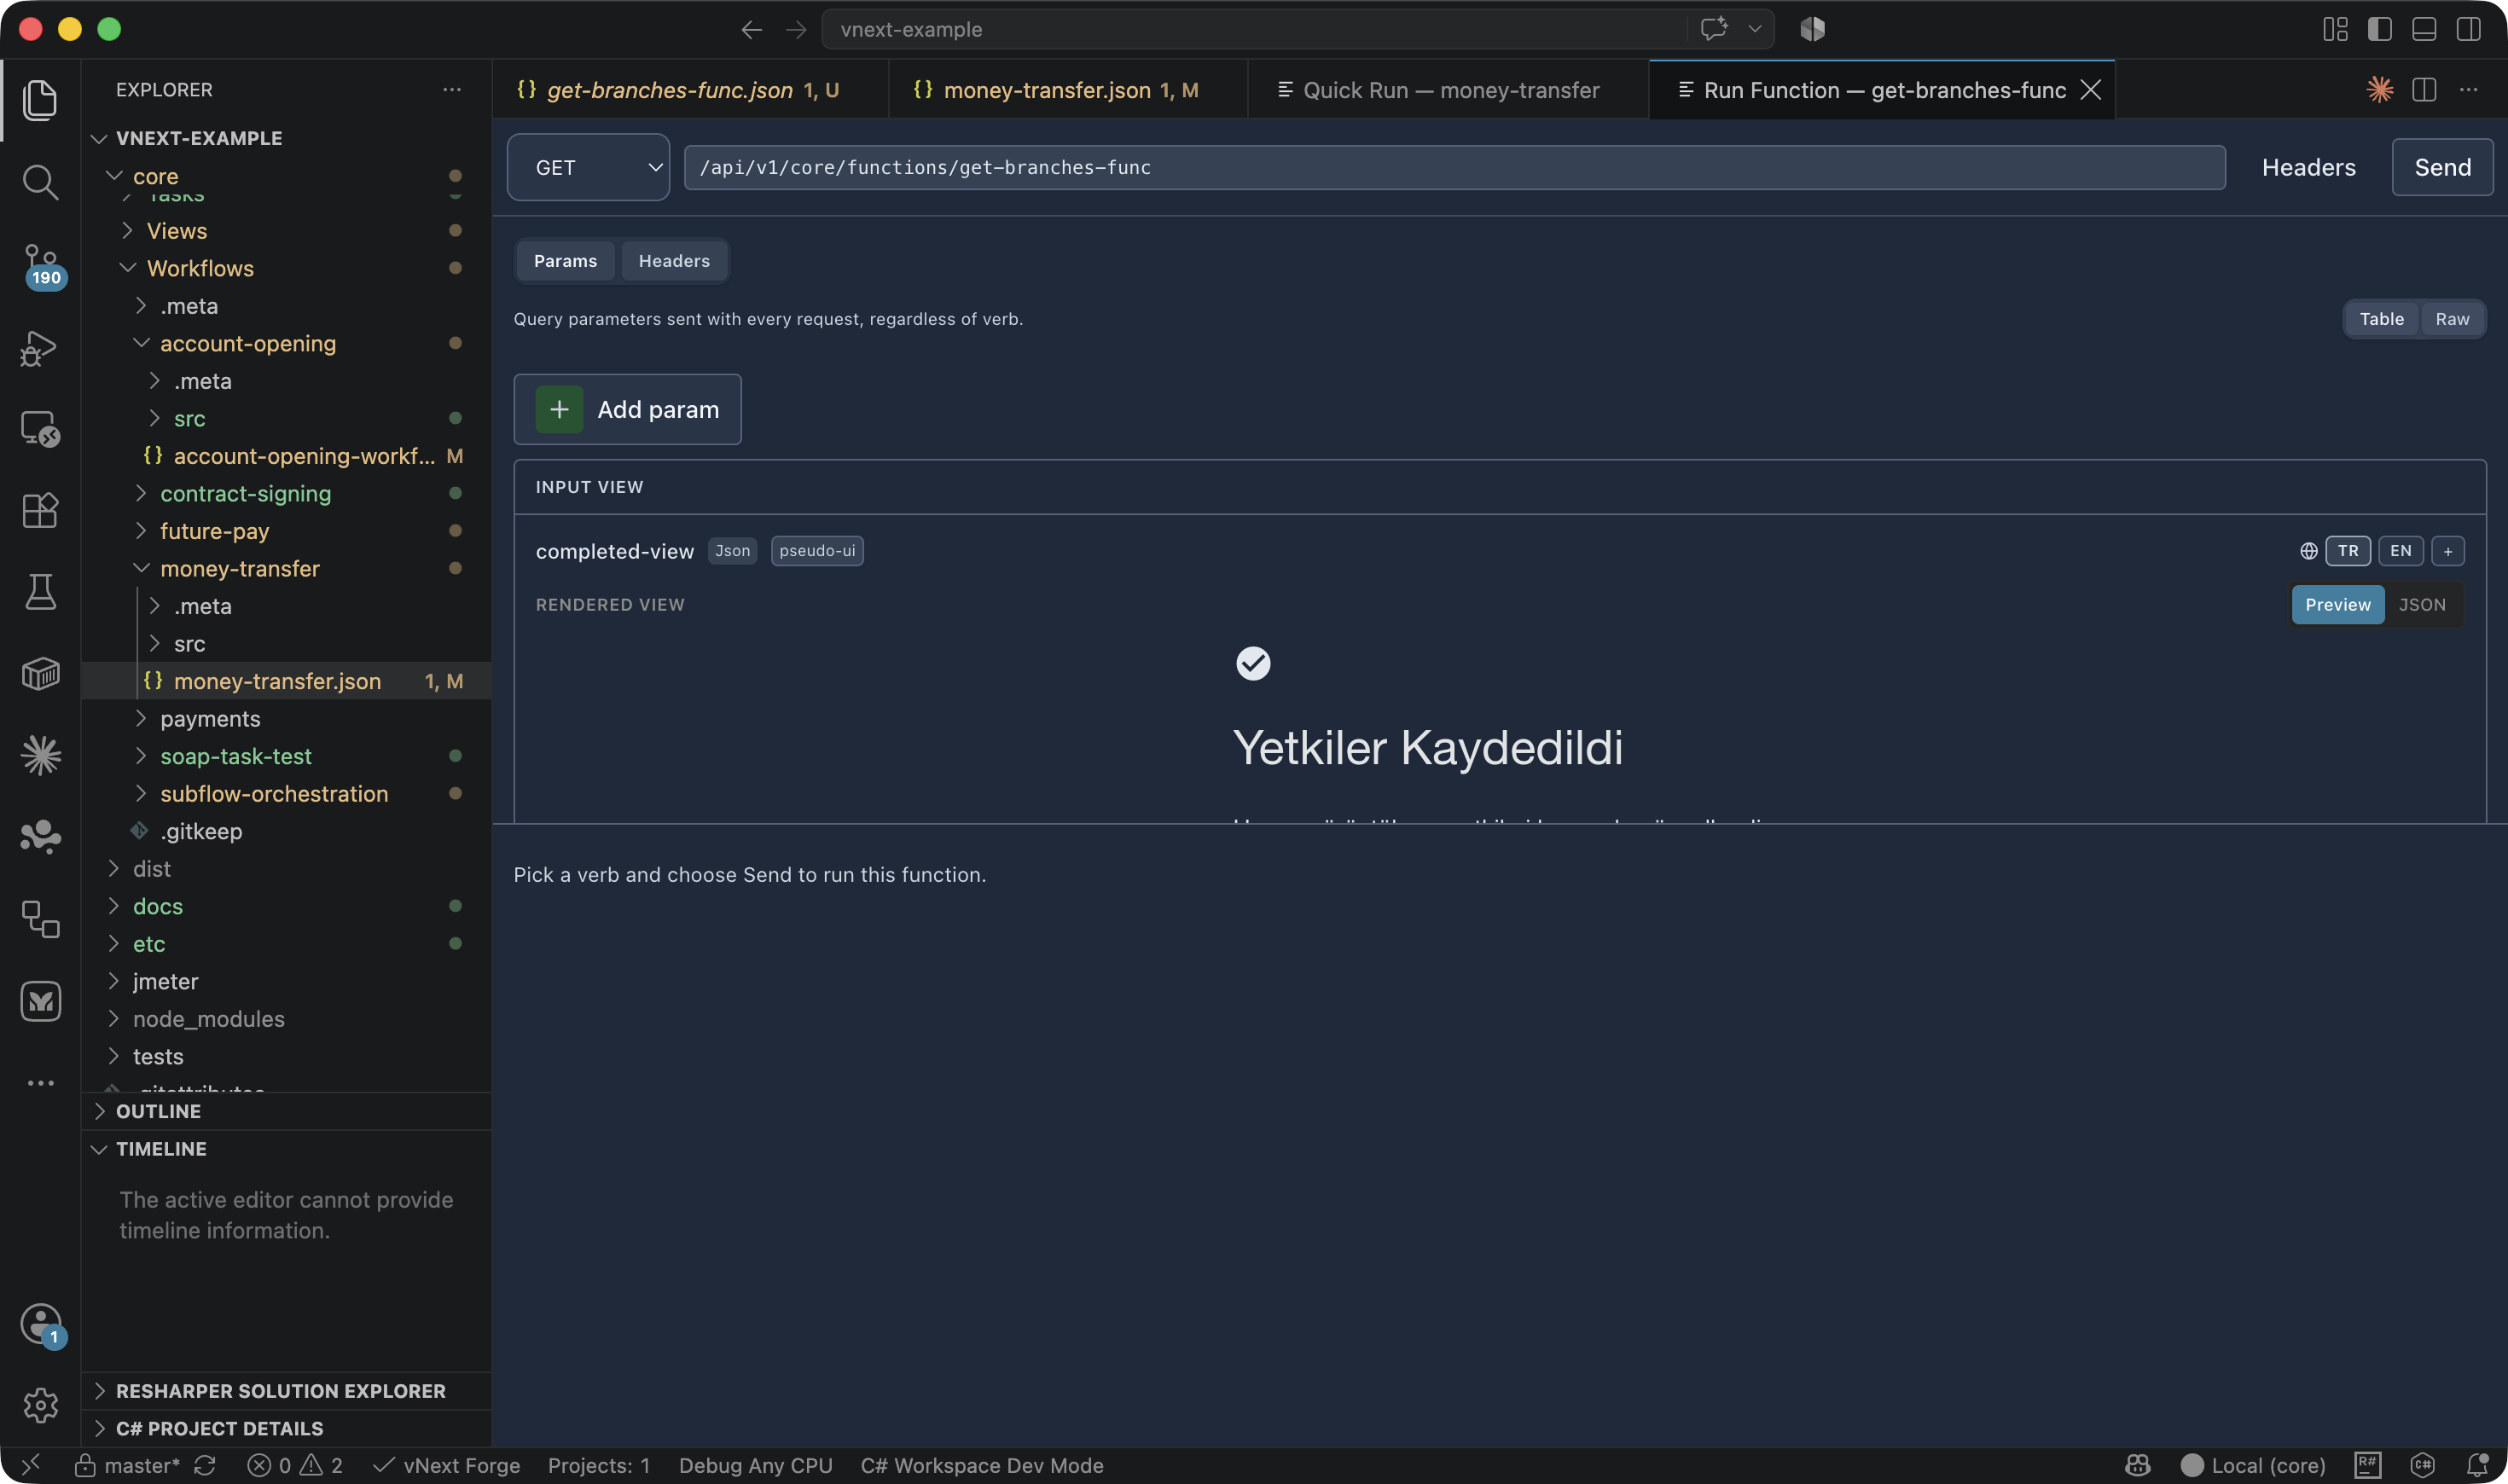
- The top bar has the HTTP verb selector, the function endpoint (
/api/v1/{domain}/functions/{key}), Headers, and Send. - Params / Headers tabs — query parameters (Add param) and headers added to every request; Table/Raw offers two views.
- INPUT VIEW — the render of the function's input view (Preview when pseudo-ui).
Send issues the request and the response section opens:
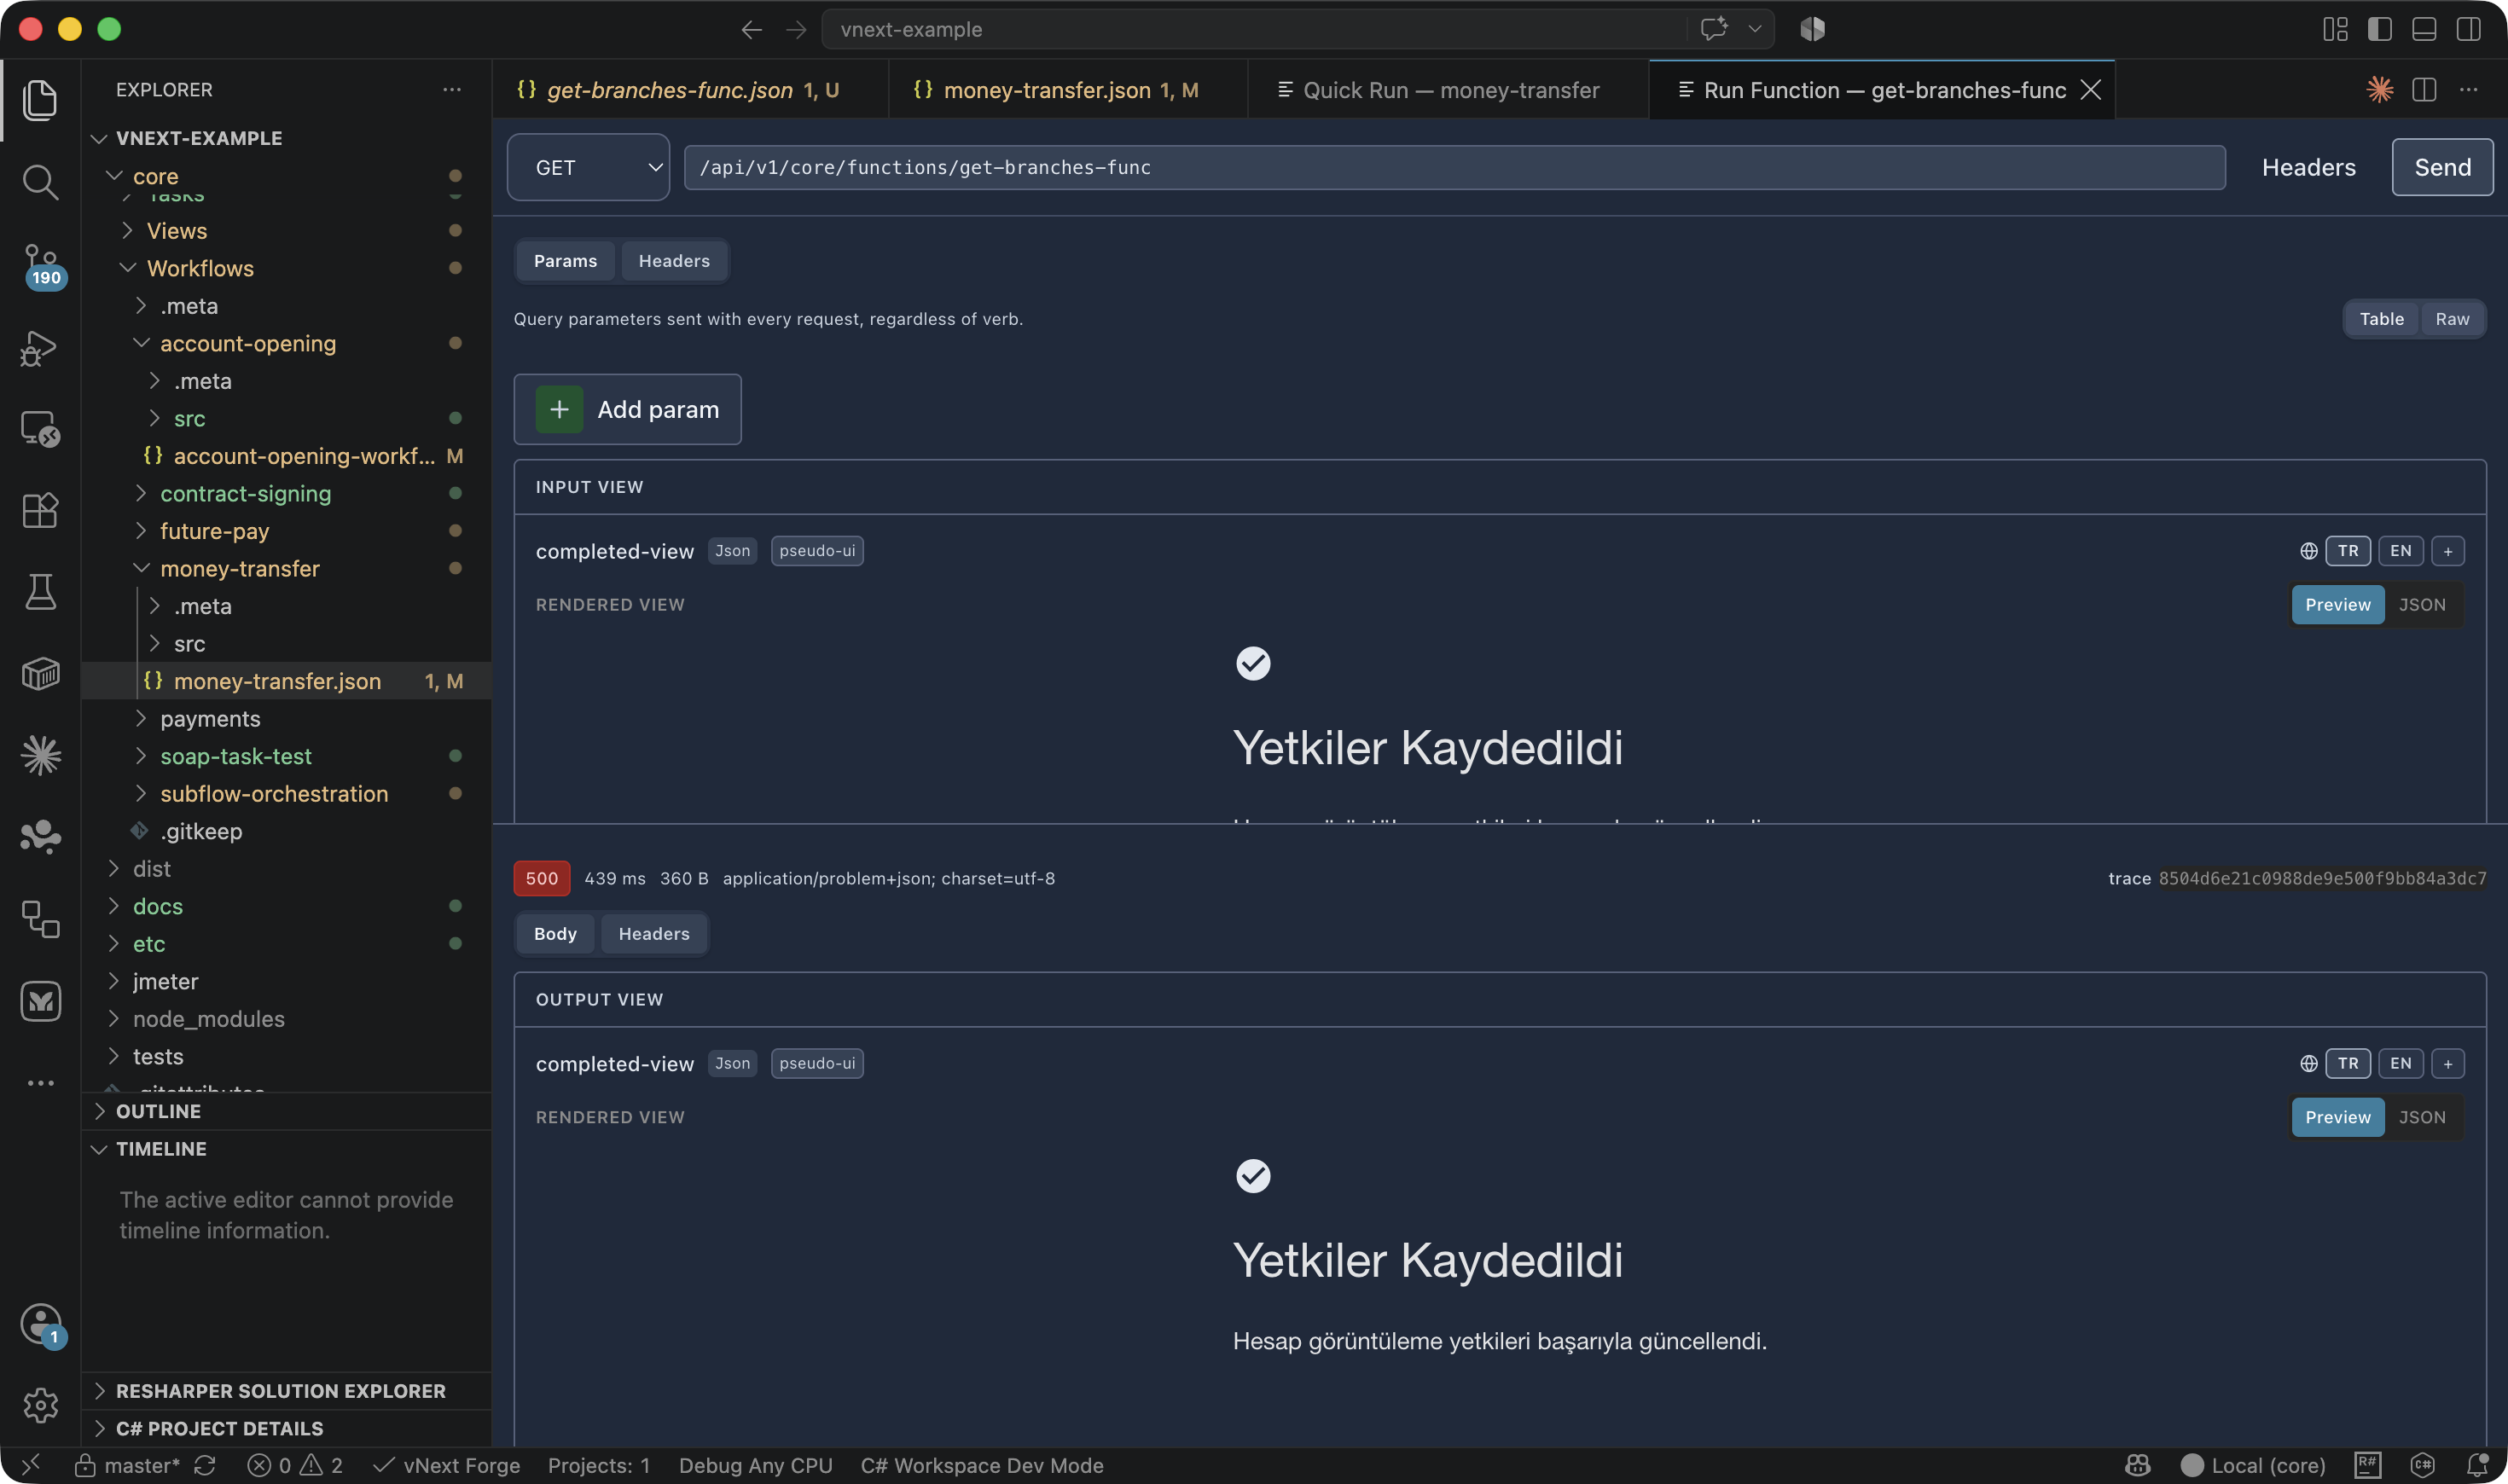
- Status line: HTTP status, duration, size, content-type, and the trace ID (copy it to jump into runtime logs).
- Body / Headers tabs — the raw response body and headers.
- OUTPUT VIEW — rendered when the function has an output handler view.
- On errors the runtime returns
application/problem+json(the 500 in the example is due to a stopped backend dependency); use the trace ID to dig into the runtime logs.
Related Pages
- Forge Usage Guide — Forge Tools panels, context menus, designers
- Development Environment Setup (Forge) — adding and managing environments
- Functions — function component reference
- Pseudo UI Guide — the view render vocabulary